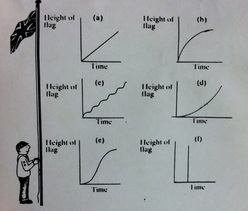
1) Graph A would look like the flag moving up at a consistent pace.
Graph B would look like the flag moving up kinda fast at first then it slows down.
Graph C would look like the flag moving up slow then fast then slow then fast until it reaches the top.
Graph D would be the opposite of Graph B, it would move up kinda slow at first then it will suddenly speed up.
Graph E would be that the flag goes up slowly at first then it goes fast then it goes slow again once it just about reaches the top.
Graph F would be the flag not moving at all and then it flies up in no time.
2) Graph A is the most realistic because they likely move up at a constant pace
3) Graph F is the least realistic because a flag can not go up in less than a second.
 RSS Feed
